
 eOn
eOn
Morse Pt NEB (built-in potential)
A compact Pt surface / adatom band on the built-in morse_pt potential.
Geometries match benchmarks/data/neb_morse_pt/.
Both plot cells pass --ira-kmax 1.8.
That value is the usual factor on the basis search for similar structures.
A larger factor leaves this match unchanged and the search then dominates the plot.
Workflow:
write
config.iniand copy endpointsrun
eonclientplot 1D profiles and a 2D reaction-valley landscape with the current
rgpycrumbs eon plt-nebconventions (full history, 1:1 Å panel, structure strip)
Prerequisites
which eonclient
python -c "import rgpycrumbs, chemparseplot, readcon"
Setup and run
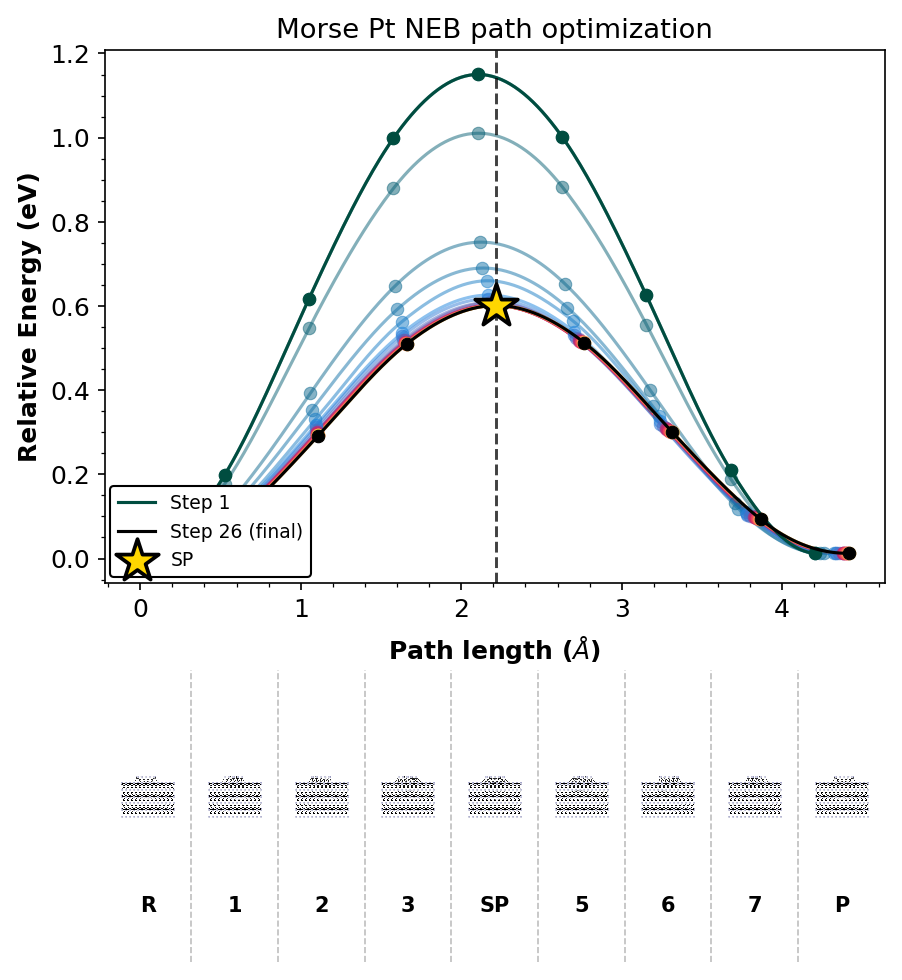
1D energy profiles (full history)
Plot every optimization step, mark the final band, and attach a structure
strip for all images on the path (--plot-structures all). The saddle is
marked with a gold star on the final profile.
neb_profile = plot_dir / "neb_1d.png"
run_rgpycrumbs(
    "eon",
    "plt-neb",
    "--con-file",
    str(work / "neb.con"),
    "--input-dat-pattern",
    str(work / "neb_*.dat"),
    "--ira-kmax",
    "1.8",
    "--plot-type",
    "profile",
    "--highlight-last",
    "--show-pts",
    "--plot-structures",
    "all",
    "--strip-renderer",
    "xyzrender",
    "--strip-dividers",
    "--xyzrender-config",
    "paton",
    "--rotation",
    "90x,0y,0z",
    "--show-legend",
    "--title",
    "Morse Pt NEB path optimization",
    "--dpi",
    "150",
    "--output-file",
    str(neb_profile),
    cwd=work,
)
show_plot(neb_profile)
$ /home/runner/work/eOn/eOn/.pixi/envs/docs-mta/bin/python3.12 -m rgpycrumbs.cli eon plt-neb --con-file /tmp/eon_morse_pt_neb_b43k8qxn/neb.con --input-dat-pattern /tmp/eon_morse_pt_neb_b43k8qxn/neb_*.dat --ira-kmax 1.8 --plot-type profile --highlight-last --show-pts --plot-structures all --strip-renderer xyzrender --strip-dividers --xyzrender-config paton --rotation 90x,0y,0z --show-legend --title Morse Pt NEB path optimization --dpi 150 --output-file /tmp/eon_morse_pt_neb_b43k8qxn/plots/neb_1d.png
--> Dispatching to: /home/runner/work/eOn/eOn/.pixi/envs/docs-mta/bin/python3.12 /home/runner/work/eOn/eOn/.pixi/envs/docs-mta/lib/python3.12/site-packages/rgpycrumbs/eon/plt_neb.py --con-file /tmp/eon_morse_pt_neb_b43k8qxn/neb.con --input-dat-pattern /tmp/eon_morse_pt_neb_b43k8qxn/neb_*.dat --ira-kmax 1.8 --plot-type profile --highlight-last --show-pts --plot-structures all --strip-renderer xyzrender --strip-dividers --xyzrender-config paton --rotation 90x,0y,0z --show-legend --title Morse Pt NEB path optimization --dpi 150 --output-file /tmp/eon_morse_pt_neb_b43k8qxn/plots/neb_1d.png
[10/21/26 23:03:43] INFO     INFO - Setting global rcParams for ruhi theme
                    WARNING  WARNING - Font 'Atkinson Hyperlegible' not found.
                             Falling back to 'sans-serif'.
                    INFO     INFO - Reading structures from
                             /tmp/eon_morse_pt_neb_b43k8qxn/neb.con
                    INFO     INFO - Loaded 9 structures.
                    INFO     INFO - Loading explicit saddle point from sp.con
                    INFO     INFO - Searching for files with pattern:
                             '/tmp/eon_morse_pt_neb_b43k8qxn/neb_*.dat'
                    INFO     INFO - Found 26 file(s).
[10/21/26 23:03:44] INFO     INFO - Loading /tmp/tmpjio_0r2d.xyz
                    INFO     INFO - Built graph: 343 atoms, 1626 bonds
[10/21/26 23:03:45] INFO     INFO - Loading /tmp/tmpcf9h3rj1.xyz
                    INFO     INFO - Built graph: 343 atoms, 1626 bonds
[10/21/26 23:03:47] INFO     INFO - Loading /tmp/tmpkfwctarb.xyz
                    INFO     INFO - Built graph: 343 atoms, 1626 bonds
[10/21/26 23:03:48] INFO     INFO - Loading /tmp/tmpqns1oxgc.xyz
                    INFO     INFO - Built graph: 343 atoms, 1628 bonds
[10/21/26 23:03:49] INFO     INFO - Loading /tmp/tmpju4zjxsc.xyz
                    INFO     INFO - Built graph: 343 atoms, 1629 bonds
[10/21/26 23:03:51] INFO     INFO - Loading /tmp/tmpyhwovbi1.xyz
                    INFO     INFO - Built graph: 343 atoms, 1628 bonds
[10/21/26 23:03:52] INFO     INFO - Loading /tmp/tmp73ll6xm_.xyz
                    INFO     INFO - Built graph: 343 atoms, 1626 bonds
[10/21/26 23:03:54] INFO     INFO - Loading /tmp/tmpmdtqk1ry.xyz
                    INFO     INFO - Built graph: 343 atoms, 1626 bonds
[10/21/26 23:03:55] INFO     INFO - Loading /tmp/tmpu7z9eo6m.xyz
                    INFO     INFO - Built graph: 343 atoms, 1626 bonds
[10/21/26 23:03:56] INFO     INFO - Profile content layout: main=3.55 in,
                             strip=1.95 in, figsize=(6.40, 6.91)
--> Using active interpreter (readcon/plot stack present or --dev)
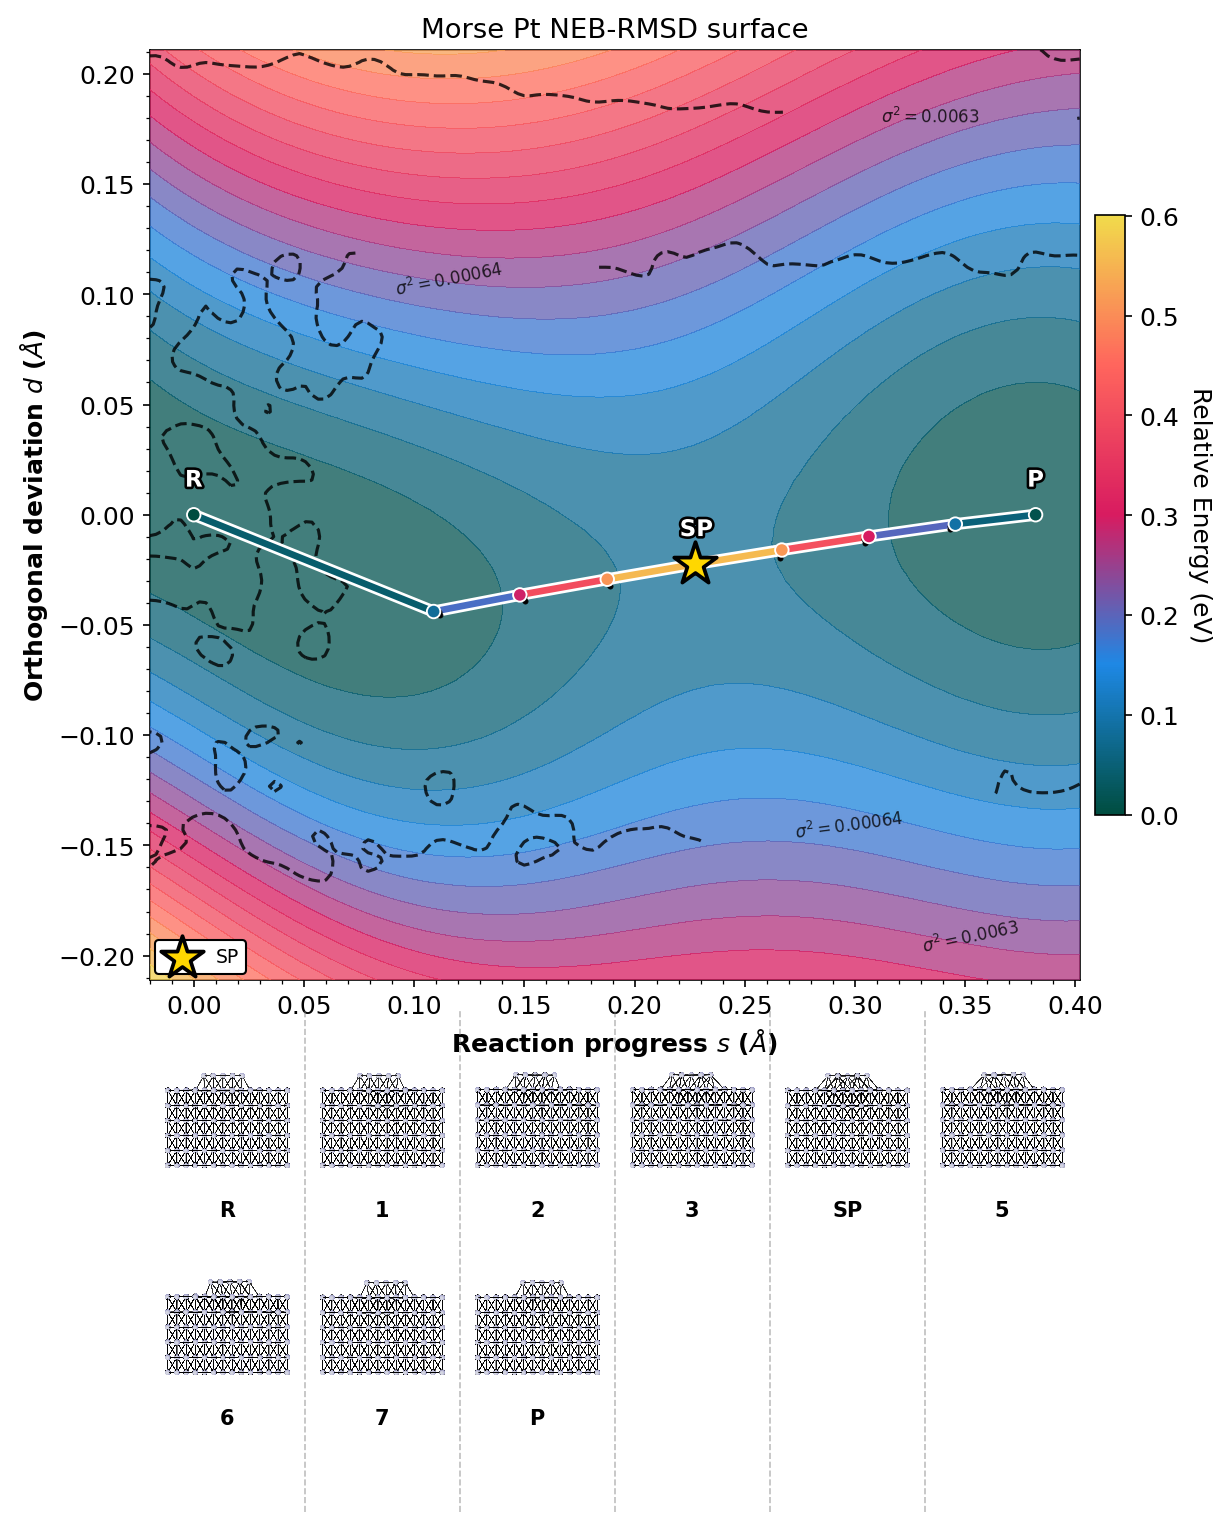
2D reaction-valley landscape
Use the full optimization history for the surface (--landscape-path all),
project into progress / orthogonal deviation (--project-path), and keep a
true 1:1 Å panel (Δs = Δd). The strip under the map shows every band image
in two rows when there are many structures.
neb_land = plot_dir / "neb_2d.png"
run_rgpycrumbs(
    "eon",
    "plt-neb",
    "--con-file",
    str(work / "neb.con"),
    "--input-dat-pattern",
    str(work / "neb_*.dat"),
    "--input-path-pattern",
    str(work / "neb_path_*.con"),
    "--ira-kmax",
    "1.8",
    "--plot-type",
    "landscape",
    "--rc-mode",
    "path",
    "--landscape-mode",
    "surface",
    "--landscape-path",
    "all",
    "--surface-type",
    "grad_imq",
    "--project-path",
    "--show-pts",
    "--highlight-last",
    "--plot-structures",
    "all",
    "--strip-renderer",
    "xyzrender",
    "--strip-dividers",
    "--xyzrender-config",
    "paton",
    "--rotation",
    "90x,0y,0z",
    "--show-legend",
    "--title",
    "Morse Pt NEB-RMSD surface",
    "--dpi",
    "150",
    "--output-file",
    str(neb_land),
    cwd=work,
)
show_plot(neb_land)
$ /home/runner/work/eOn/eOn/.pixi/envs/docs-mta/bin/python3.12 -m rgpycrumbs.cli eon plt-neb --con-file /tmp/eon_morse_pt_neb_b43k8qxn/neb.con --input-dat-pattern /tmp/eon_morse_pt_neb_b43k8qxn/neb_*.dat --input-path-pattern /tmp/eon_morse_pt_neb_b43k8qxn/neb_path_*.con --ira-kmax 1.8 --plot-type landscape --rc-mode path --landscape-mode surface --landscape-path all --surface-type grad_imq --project-path --show-pts --highlight-last --plot-structures all --strip-renderer xyzrender --strip-dividers --xyzrender-config paton --rotation 90x,0y,0z --show-legend --title Morse Pt NEB-RMSD surface --dpi 150 --output-file /tmp/eon_morse_pt_neb_b43k8qxn/plots/neb_2d.png
--> Dispatching to: /home/runner/work/eOn/eOn/.pixi/envs/docs-mta/bin/python3.12 /home/runner/work/eOn/eOn/.pixi/envs/docs-mta/lib/python3.12/site-packages/rgpycrumbs/eon/plt_neb.py --con-file /tmp/eon_morse_pt_neb_b43k8qxn/neb.con --input-dat-pattern /tmp/eon_morse_pt_neb_b43k8qxn/neb_*.dat --input-path-pattern /tmp/eon_morse_pt_neb_b43k8qxn/neb_path_*.con --ira-kmax 1.8 --plot-type landscape --rc-mode path --landscape-mode surface --landscape-path all --surface-type grad_imq --project-path --show-pts --highlight-last --plot-structures all --strip-renderer xyzrender --strip-dividers --xyzrender-config paton --rotation 90x,0y,0z --show-legend --title Morse Pt NEB-RMSD surface --dpi 150 --output-file /tmp/eon_morse_pt_neb_b43k8qxn/plots/neb_2d.png
[10/21/26 23:03:59] INFO     INFO - Setting global rcParams for ruhi theme
                    WARNING  WARNING - Font 'Atkinson Hyperlegible' not found.
                             Falling back to 'sans-serif'.
                    INFO     INFO - Reading structures from
                             /tmp/eon_morse_pt_neb_b43k8qxn/neb.con
                    INFO     INFO - Loaded 9 structures.
                    INFO     INFO - Loading explicit saddle point from sp.con
                    INFO     INFO - Searching for files with pattern:
                             '/tmp/eon_morse_pt_neb_b43k8qxn/neb_*.dat'
                    INFO     INFO - Found 26 file(s).
                    INFO     INFO - Searching for files with pattern:
                             '/tmp/eon_morse_pt_neb_b43k8qxn/neb_path_*.con'
                    INFO     INFO - Found 26 file(s).
                    INFO     INFO - Computing Landscape data...
[10/21/26 23:04:16] INFO     INFO - Saving Landscape cache to
                             .neb_landscape.parquet...
                    INFO     INFO - Calculated heuristic RBF smoothing: 0.0395
                    INFO     INFO - Generating 2D surface using grad_imq
                             (Projected: True)...
[10/21/26 23:04:17] INFO     INFO - Unable to initialize backend 'tpu':
                             INTERNAL: Failed to open libtpu.so: libtpu.so:
                             cannot open shared object file: No such file or
                             directory
                    INFO     INFO - Unable to initialize backend 'proxy': The
                             'proxy' backend requires the address of an IFRT
                             Proxy server. Set it via the JAX_BACKEND_TARGET
                             environment variable or the jax_backend_target
                             config option, e.g.
                             JAX_BACKEND_TARGET=grpc://localhost:29000.
[10/21/26 23:04:26] INFO     INFO - Plotting explicit SP at R=0.114, P=0.113
                    WARNING  WARNING - Looks like you are using a tranform that
                             doesn't support FancyArrowPatch, using ax.annotate
                             instead. The arrows might strike through texts.
                             Increasing shrinkA in arrowprops might help.
                    INFO     INFO - Loading /tmp/tmpak4dvkqd.xyz
                    INFO     INFO - Built graph: 343 atoms, 1626 bonds
[10/21/26 23:04:27] INFO     INFO - Loading /tmp/tmpy3577f2h.xyz
[10/21/26 23:04:28] INFO     INFO - Built graph: 343 atoms, 1626 bonds
                    INFO     INFO - Loading /tmp/tmpyzlws3z_.xyz
[10/21/26 23:04:29] INFO     INFO - Built graph: 343 atoms, 1626 bonds
[10/21/26 23:04:30] INFO     INFO - Loading /tmp/tmpmnpb26f7.xyz
                    INFO     INFO - Built graph: 343 atoms, 1628 bonds
[10/21/26 23:04:31] INFO     INFO - Loading /tmp/tmpcuoh7hl3.xyz
                    INFO     INFO - Built graph: 343 atoms, 1629 bonds
[10/21/26 23:04:32] INFO     INFO - Loading /tmp/tmpgtb_zj0j.xyz
                    INFO     INFO - Built graph: 343 atoms, 1628 bonds
[10/21/26 23:04:33] INFO     INFO - Loading /tmp/tmp5hd5f1ru.xyz
                    INFO     INFO - Built graph: 343 atoms, 1626 bonds
[10/21/26 23:04:34] INFO     INFO - Loading /tmp/tmpblx9fdnz.xyz
                    INFO     INFO - Built graph: 343 atoms, 1626 bonds
[10/21/26 23:04:35] INFO     INFO - Loading /tmp/tmpr96m794k.xyz
[10/21/26 23:04:36] INFO     INFO - Built graph: 343 atoms, 1626 bonds
[10/21/26 23:04:37] INFO     INFO - Set 1:1 (s,d) square panel: Δs=Δd=0.422 Å
                             (s=[-0.020, 0.402], d=[-0.211, 0.211]);
                             strip_rows=2; figsize=(8.35, 10.48) in
--> Using active interpreter (readcon/plot stack present or --dev)
See also
Visualizing optimization trajectories: PET-MAD / vinyl alcohol visualization walkthrough
Nudged elastic band: NEB parameters
atomistic-cookbook eon-pet-neb: metatomic oxadiazole NEB with the same plot stack